Post #3 - Creativity in Organization: Google Sheets Dashboards
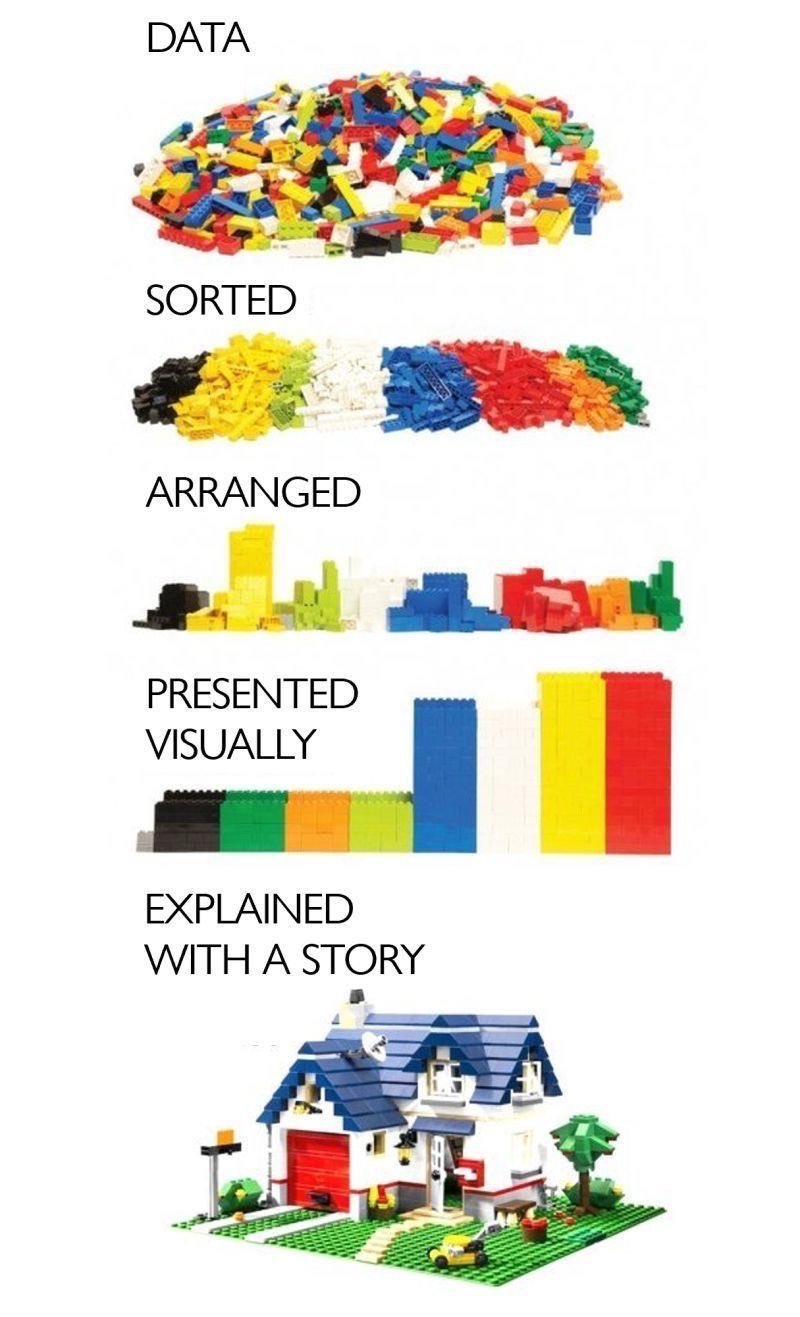
The other day, as I scrolled aimlessly down my Twitter feed, I stumbled across this graphic on Twitter. It caused me to pause, enlarge the picture, read the caption, and then return to scrolling. However, the difference with this picture as opposed to other things I’ve stumbled across on Twitter is that I’m still thinking about it today.
What I love about the picture is that you almost don’t need the words to understand its message. It’s informing us that data, loose piles of seemingly unrelated information, can always be packaged in a way that communicates a narrative. Whenever the imagination is assumed to be the cause behind an event, it immediately causes us to ask “Why?” related questions. This is good teaching.
And this is why I love spreadsheets!
Spreadsheets begin as endless rows of empty cells, neatly organized in columns and rows; a pure, blank canvas. What’s hidden in each cell though are endless formulas and shortcuts that can allow any creator to manipulate them for artistic and imaginative purposes.
I have always enjoyed goofing around with spreadsheets, but it was typically for the sole purpose of organizing baseball statistics or populating March Madness brackets. It wasn’t until I began coaching cross country that I began using my knack for number crunching for a professional purpose. After a few seasons of gathering large amounts of running data and analyzing trends to help us in our races, I realized I could also be using Google Sheets for educational purposes in my classroom. Music teachers often have the same students for multiple years, so having a way to analyze data over a long period of time is essential.
This year, I have decided to take a deep dive into building Google Sheets Dashboards. After watching several YouTube Videos (I will link them below), I was able to finally create my first sheet that consisted of several Vlookup functions, Quarry reports, and arrays containing data from multiple Google Sheets. It now allows me to select any student’s name and instantly see how their audition scores and sightreading ability compare to the class median.

For me, that’s a lego house I’m proud of.
If you would like to know more about how I constructed this, leave me a comment on this post or email me at david.getz@mcusd709.org. You can also follow me on Instagram @davidgetzcreative; I’d love to connect with other educators who are seeking to use creativity to positively impact their student’s learning experience.
GOOGLE SHEETS DASHBOARD TUTORIAL (HustleSheets)